Visualize Your Business Growth with Modern Infographic Templates
Every successful brand understands that data alone rarely inspires action. It’s the visual story behind the numbers—the timeline of milestones, the flow of processes, the hierarchy of ideas—that transforms complex information into compelling narratives. A well-designed modern infographic does more than present facts; it guides your audience through a journey, making abstract concepts tangible and memorable. For designers, marketers, and business owners, having a versatile template that balances aesthetic appeal with functional clarity isn’t just convenient—it’s essential for standing out in a crowded visual landscape.
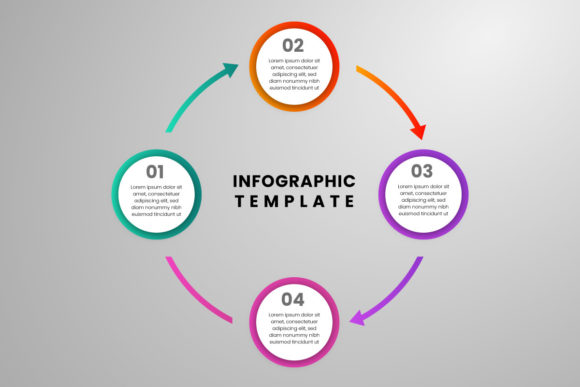
What Makes a Modern Infographic Visually Effective?
The power of contemporary infographic design lies in its ability to merge clean aesthetics with intuitive information architecture. Unlike cluttered charts of the past, modern templates prioritize whitespace, balanced composition, and strategic use of color to direct the viewer’s eye. This particular design approach uses a cohesive visual language—consistent iconography, harmonious color palettes, and thoughtful typography—to create a seamless reading experience. The result is content that feels professional yet approachable, complex yet digestible. When your infographic looks this polished, it immediately elevates the perceived value of the information it contains.
The included Poppins font family plays a crucial role in this visual harmony. As a geometric sans serif typeface, Poppins offers exceptional readability across both digital screens and print materials. Its clean, friendly letterforms work beautifully for headers, body text, and data labels alike. The font’s versatility means you can maintain brand consistency whether you’re designing a social media graphic, a website section, or a printed report. For those managing multiple design assets, having a reliable, modern typography solution that pairs well with both serif and sans serif fonts simplifies the entire creative workflow.
Practical Applications Across Your Brand Ecosystem
Think beyond the traditional data presentation. A flexible infographic template becomes a foundational design asset that adapts to numerous projects. Imagine using the same visual framework to create:
- Brand storytelling timelines for your website’s “About Us” section
- Process explanations for onboarding documents or product packaging
- Comparison charts for marketing materials and sales presentations
- Step-by-step guides for social media carousels or blog tutorials
- Milestone announcements for investor updates or internal communications
The 1200x800 pixel dimension provides ample space for detailed information while remaining optimized for digital sharing. The 300 DPI resolution ensures your designs print crisply on business cards, posters, or merchandise without pixelation. When you’re building a cohesive brand identity, having design assets that perform consistently across mediums saves countless hours and prevents visual fragmentation.
Streamlining Your Design Workflow with Editable Files
One of the greatest advantages of a professional template is how it accelerates production without sacrificing quality. The fully customizable EPS files mean you’re not locked into a rigid design—you can adjust colors to match your brand palette, rearrange elements to emphasize specific data points, or scale components without losing clarity. This level of editability transforms a template from a static download into a dynamic design system.
For small business owners and content creators, this flexibility is particularly valuable. You might start by using the template for a quarterly business review presentation, then adapt the same visual structure for a product launch infographic on Instagram. Later, you could repurpose the design elements for email newsletter graphics or printed promotional materials. The included help guide simplifies the customization process, making it accessible even for those with intermediate design skills. When your tools work with you rather than against you, creativity flows more freely and production timelines shrink dramatically.
Integrating Infographics into Your Marketing Strategy
Visual content consistently outperforms text-only communication in engagement metrics. A well-placed infographic can increase website dwell time, boost social media shares, and improve information retention. Consider how you might leverage this design approach in your specific context:
- For consultants and coaches: Visualize client success journeys or methodology frameworks
- For e-commerce brands: Explain product features, manufacturing processes, or comparison guides
- For educators and course creators: Break down complex concepts into sequential learning steps
- For nonprofit organizations: Illustrate impact metrics, program timelines, or donation allocation
The key is matching the visual style to both your brand personality and your audience’s expectations. A playful, colorful infographic might work perfectly for a children’s educational app, while a more minimalist, data-driven approach would suit a financial services firm. The template’s modern design serves as a versatile starting point that you can adapt to various brand voices through simple color and typography adjustments.
Building Visual Consistency Across Touchpoints
When your visual assets share a common design language, your brand begins to feel more established and trustworthy. Using consistent infographic templates across different platforms creates subtle recognition cues for your audience. They start to associate your specific color palette, icon style, and layout patterns with your brand—whether they encounter your content on LinkedIn, in a printed brochure, or on your website.
This consistency extends beyond mere aesthetics. Professionally designed templates ensure proper alignment, balanced proportions, and logical visual hierarchies—elements that might be overlooked when creating graphics from scratch under tight deadlines. The technical specifications matter too: RGB color mode ensures vibrant, accurate colors on digital screens, while the high resolution guarantees quality output if you decide to repurpose digital designs for print materials like trade show posters or product inserts.
Choosing and Customizing for Maximum Impact
Before diving into customization, consider your primary use case. If you’ll mainly share infographics on social media, you might prioritize bold colors and minimal text for quick comprehension. For detailed reports or educational materials, you might expand the text sections and incorporate additional data visualization elements. Take time to explore the included font styles—Poppins offers multiple weights that allow you to create visual hierarchy without introducing font conflicts.
When customizing, maintain enough contrast between text and background colors to ensure readability across devices and lighting conditions. Test your designs at various sizes, especially if they’ll appear both as large website headers and small mobile previews. Remember that the most effective infographics balance visual appeal with functional clarity—every design element should serve the goal of making information more accessible and engaging.
Ultimately, the right template becomes more than just a time-saver—it becomes a strategic asset that enhances how you communicate with your audience. By starting with a professionally designed foundation and adapting it to your specific needs, you create visual content that not only looks polished but actually performs better in achieving your communication goals. Whether you’re explaining a complex process, celebrating a milestone, or simply presenting information in a more digestible format, a thoughtfully designed modern infographic template provides the visual framework to do it effectively.